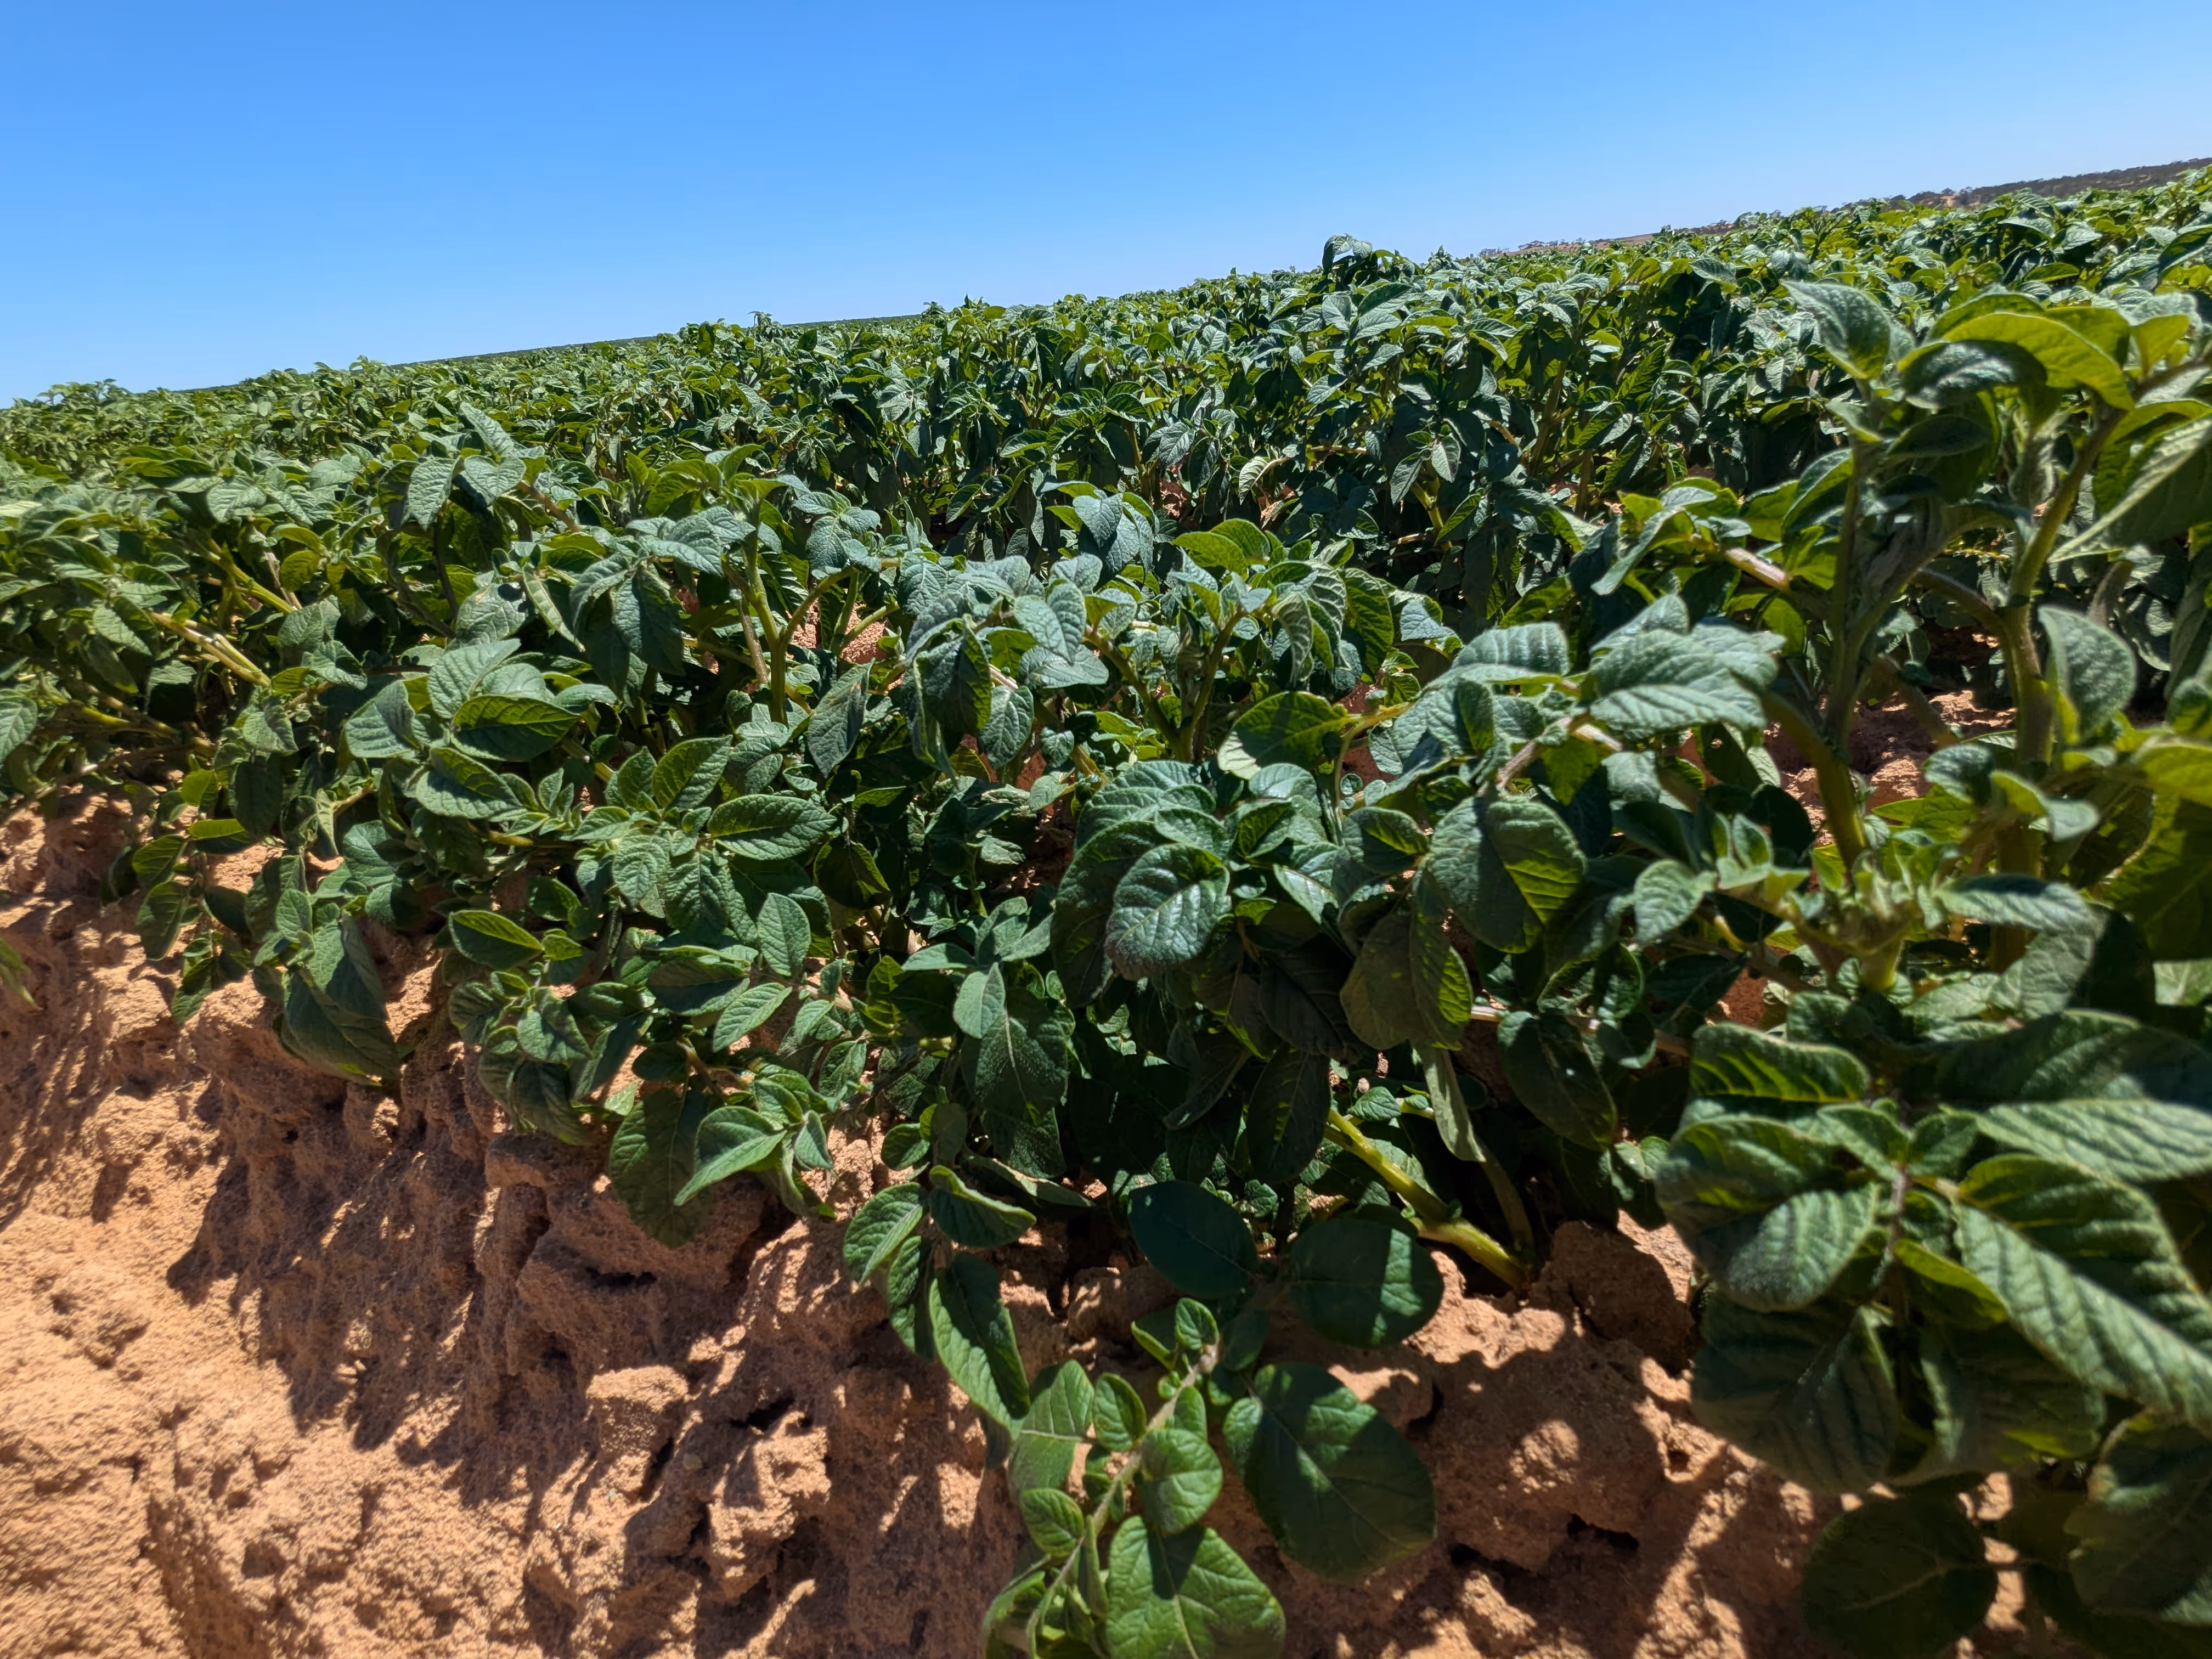
Potatoes & Vegetable Crops
AirborneLogic has worked with some of the largest pivot operators in the country. Our mapping and analysis techniques can help with targeted fertilizer spreading, plant counting and disease mapping. Some of the services we offer include:
1. Variable rate spreading
We work with your technical team to build spreading maps that work for you. We capture a range of data, run the analyses and present the options. You can chose which option best matches your needs, and we can format the results ready for your tractor. By flying when you need it flown, we can make sure that each application is perfectly targeted to the crops variability.
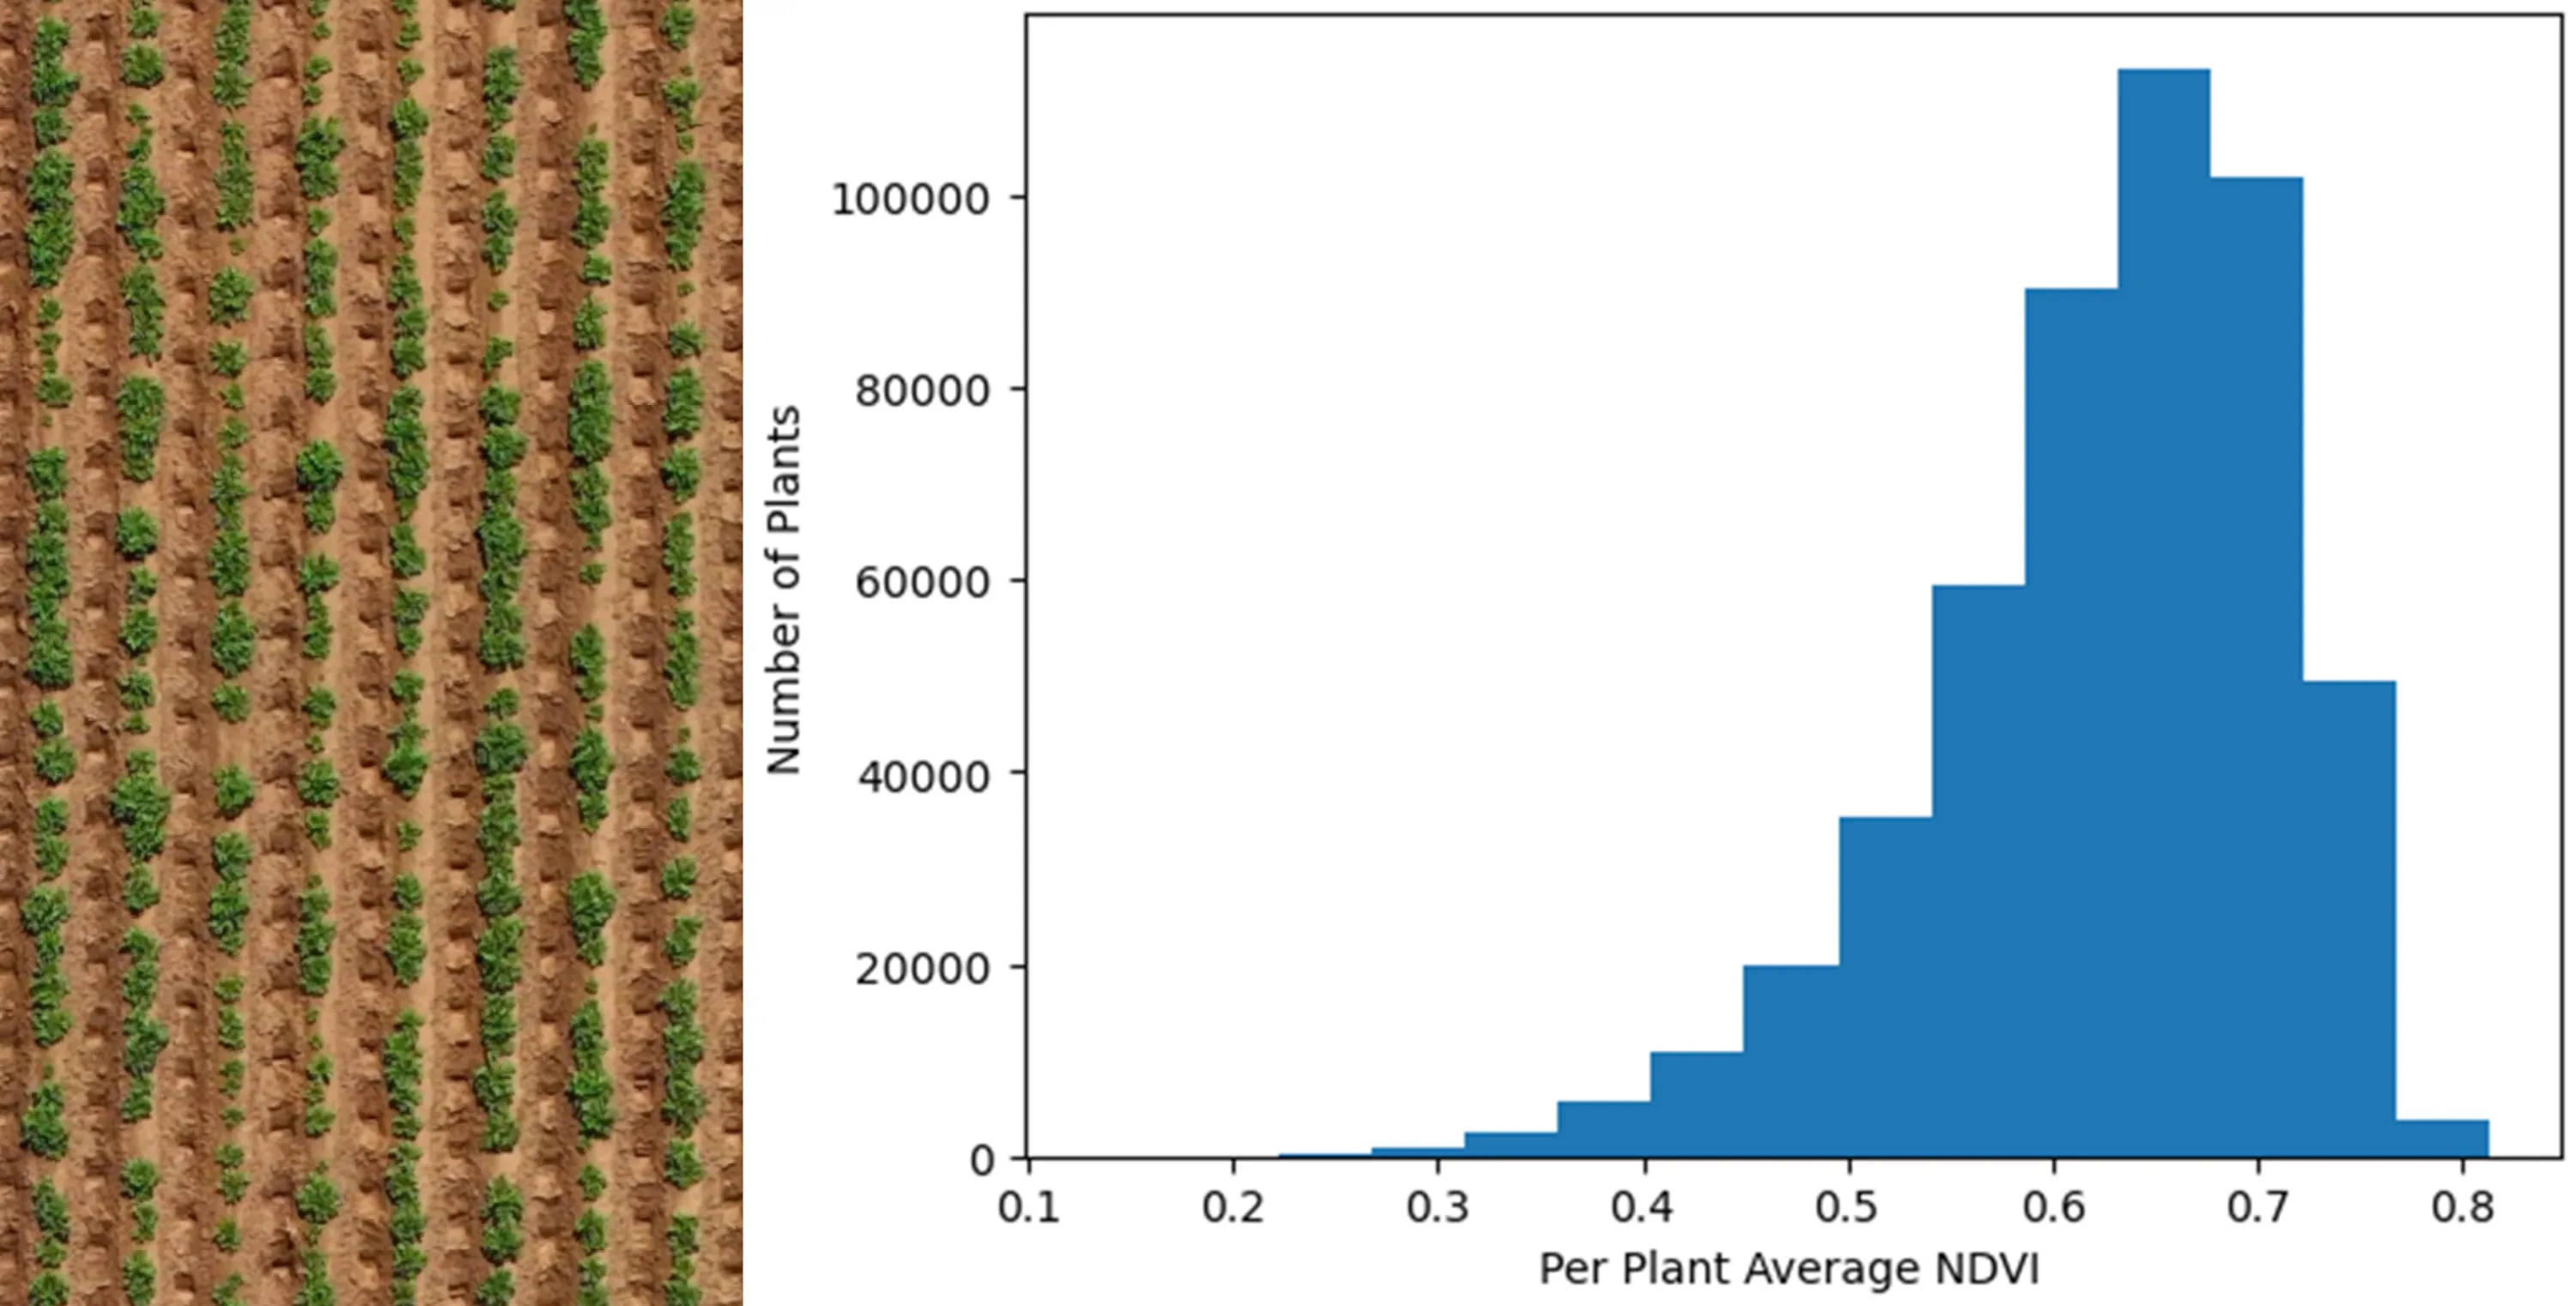
2. Plant Counting
By counting the plants in your pivot we can calculate the emergence rate of your seed.
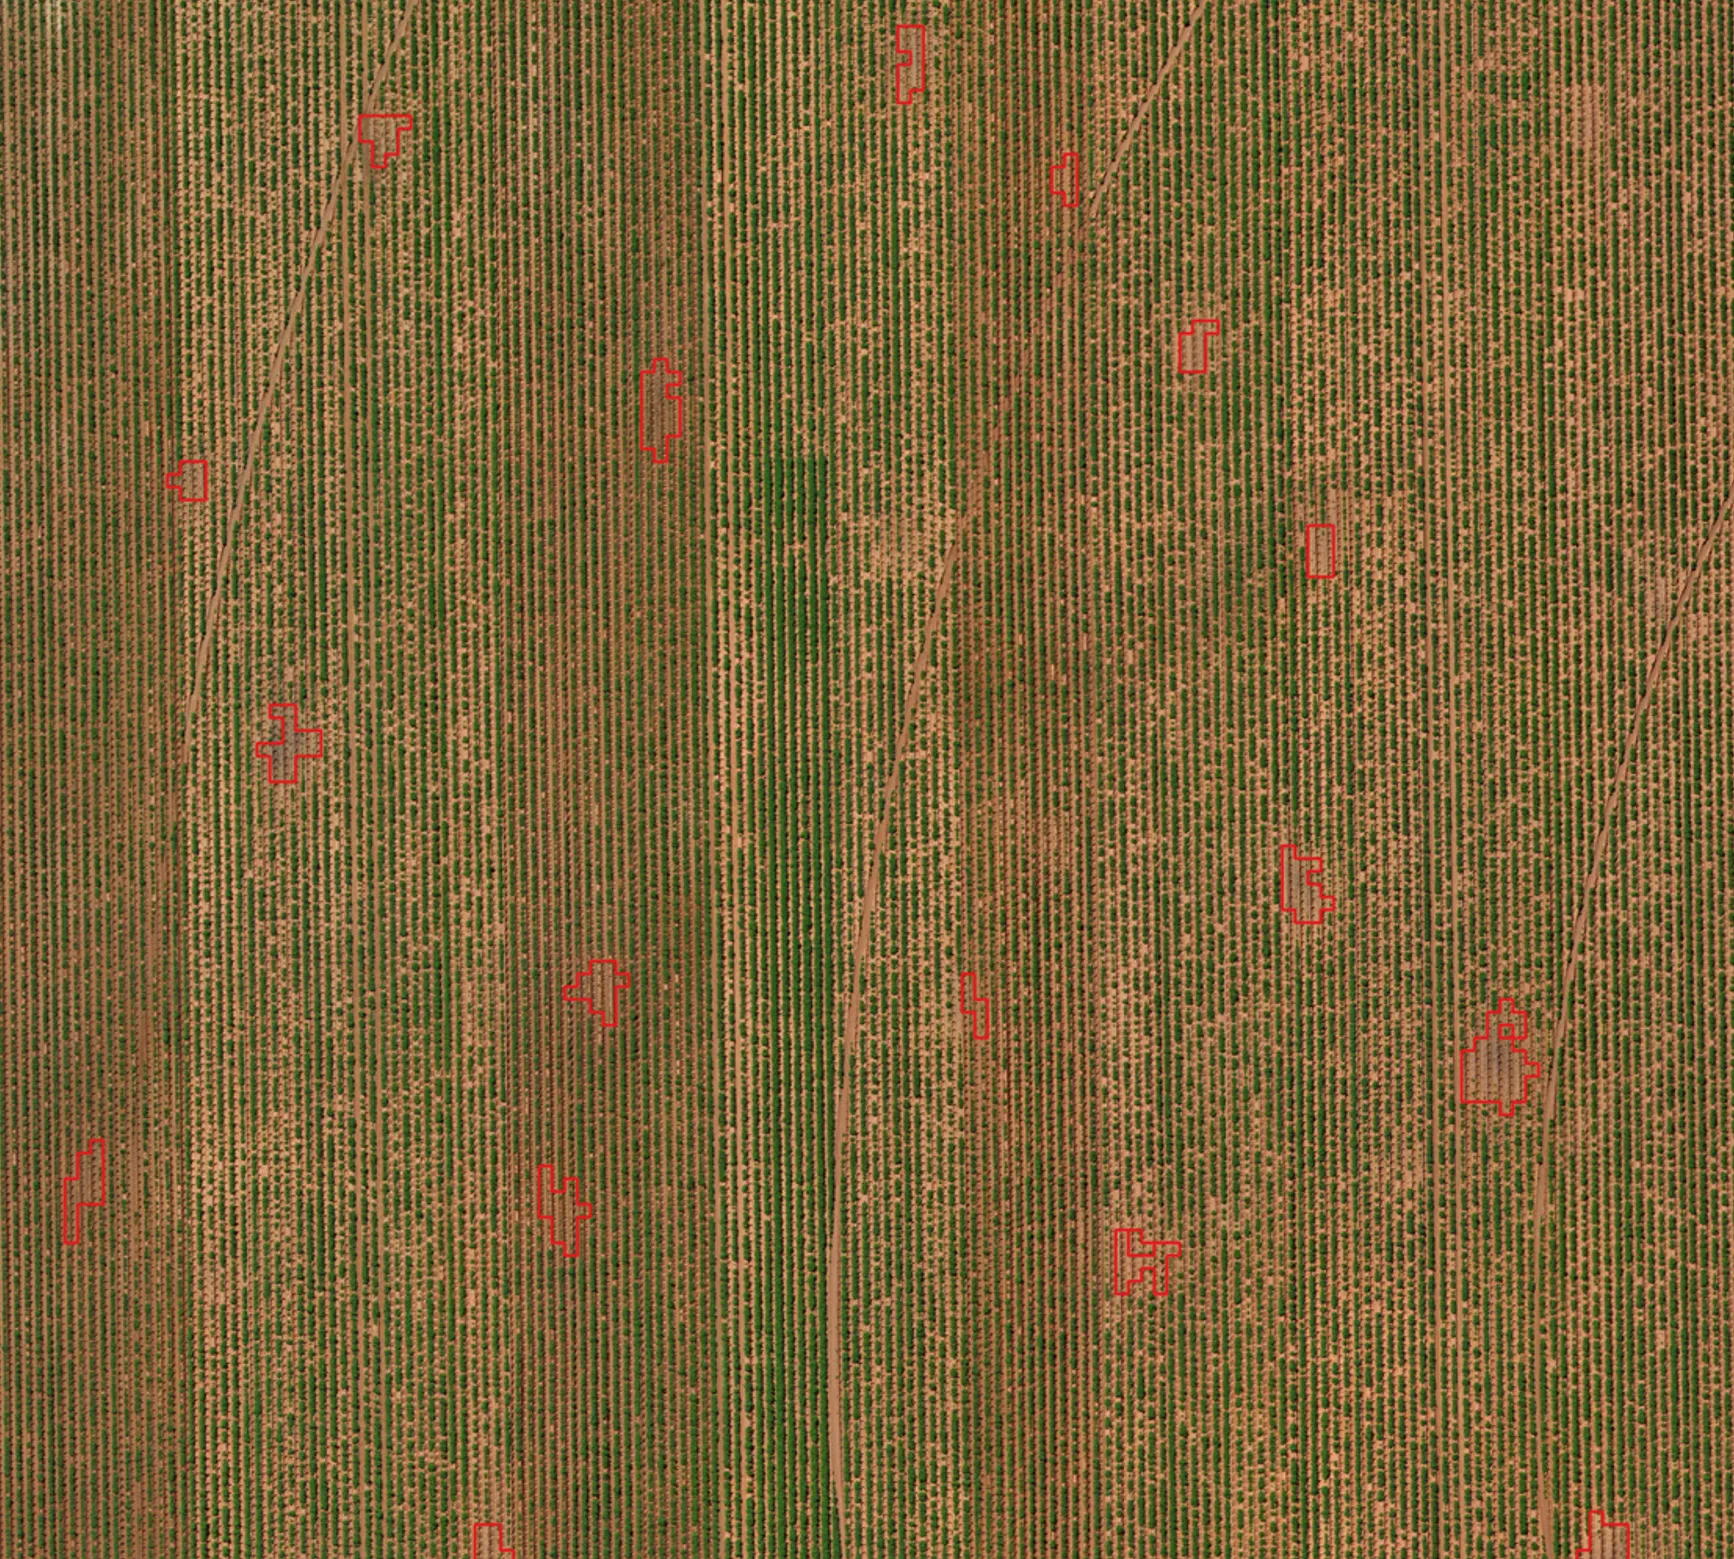
3. Disease Mapping
Overhead views are ideal for spotting variability. This is an example of rhizoctonia in potatoes that the farm managers hadn’t previously noticed
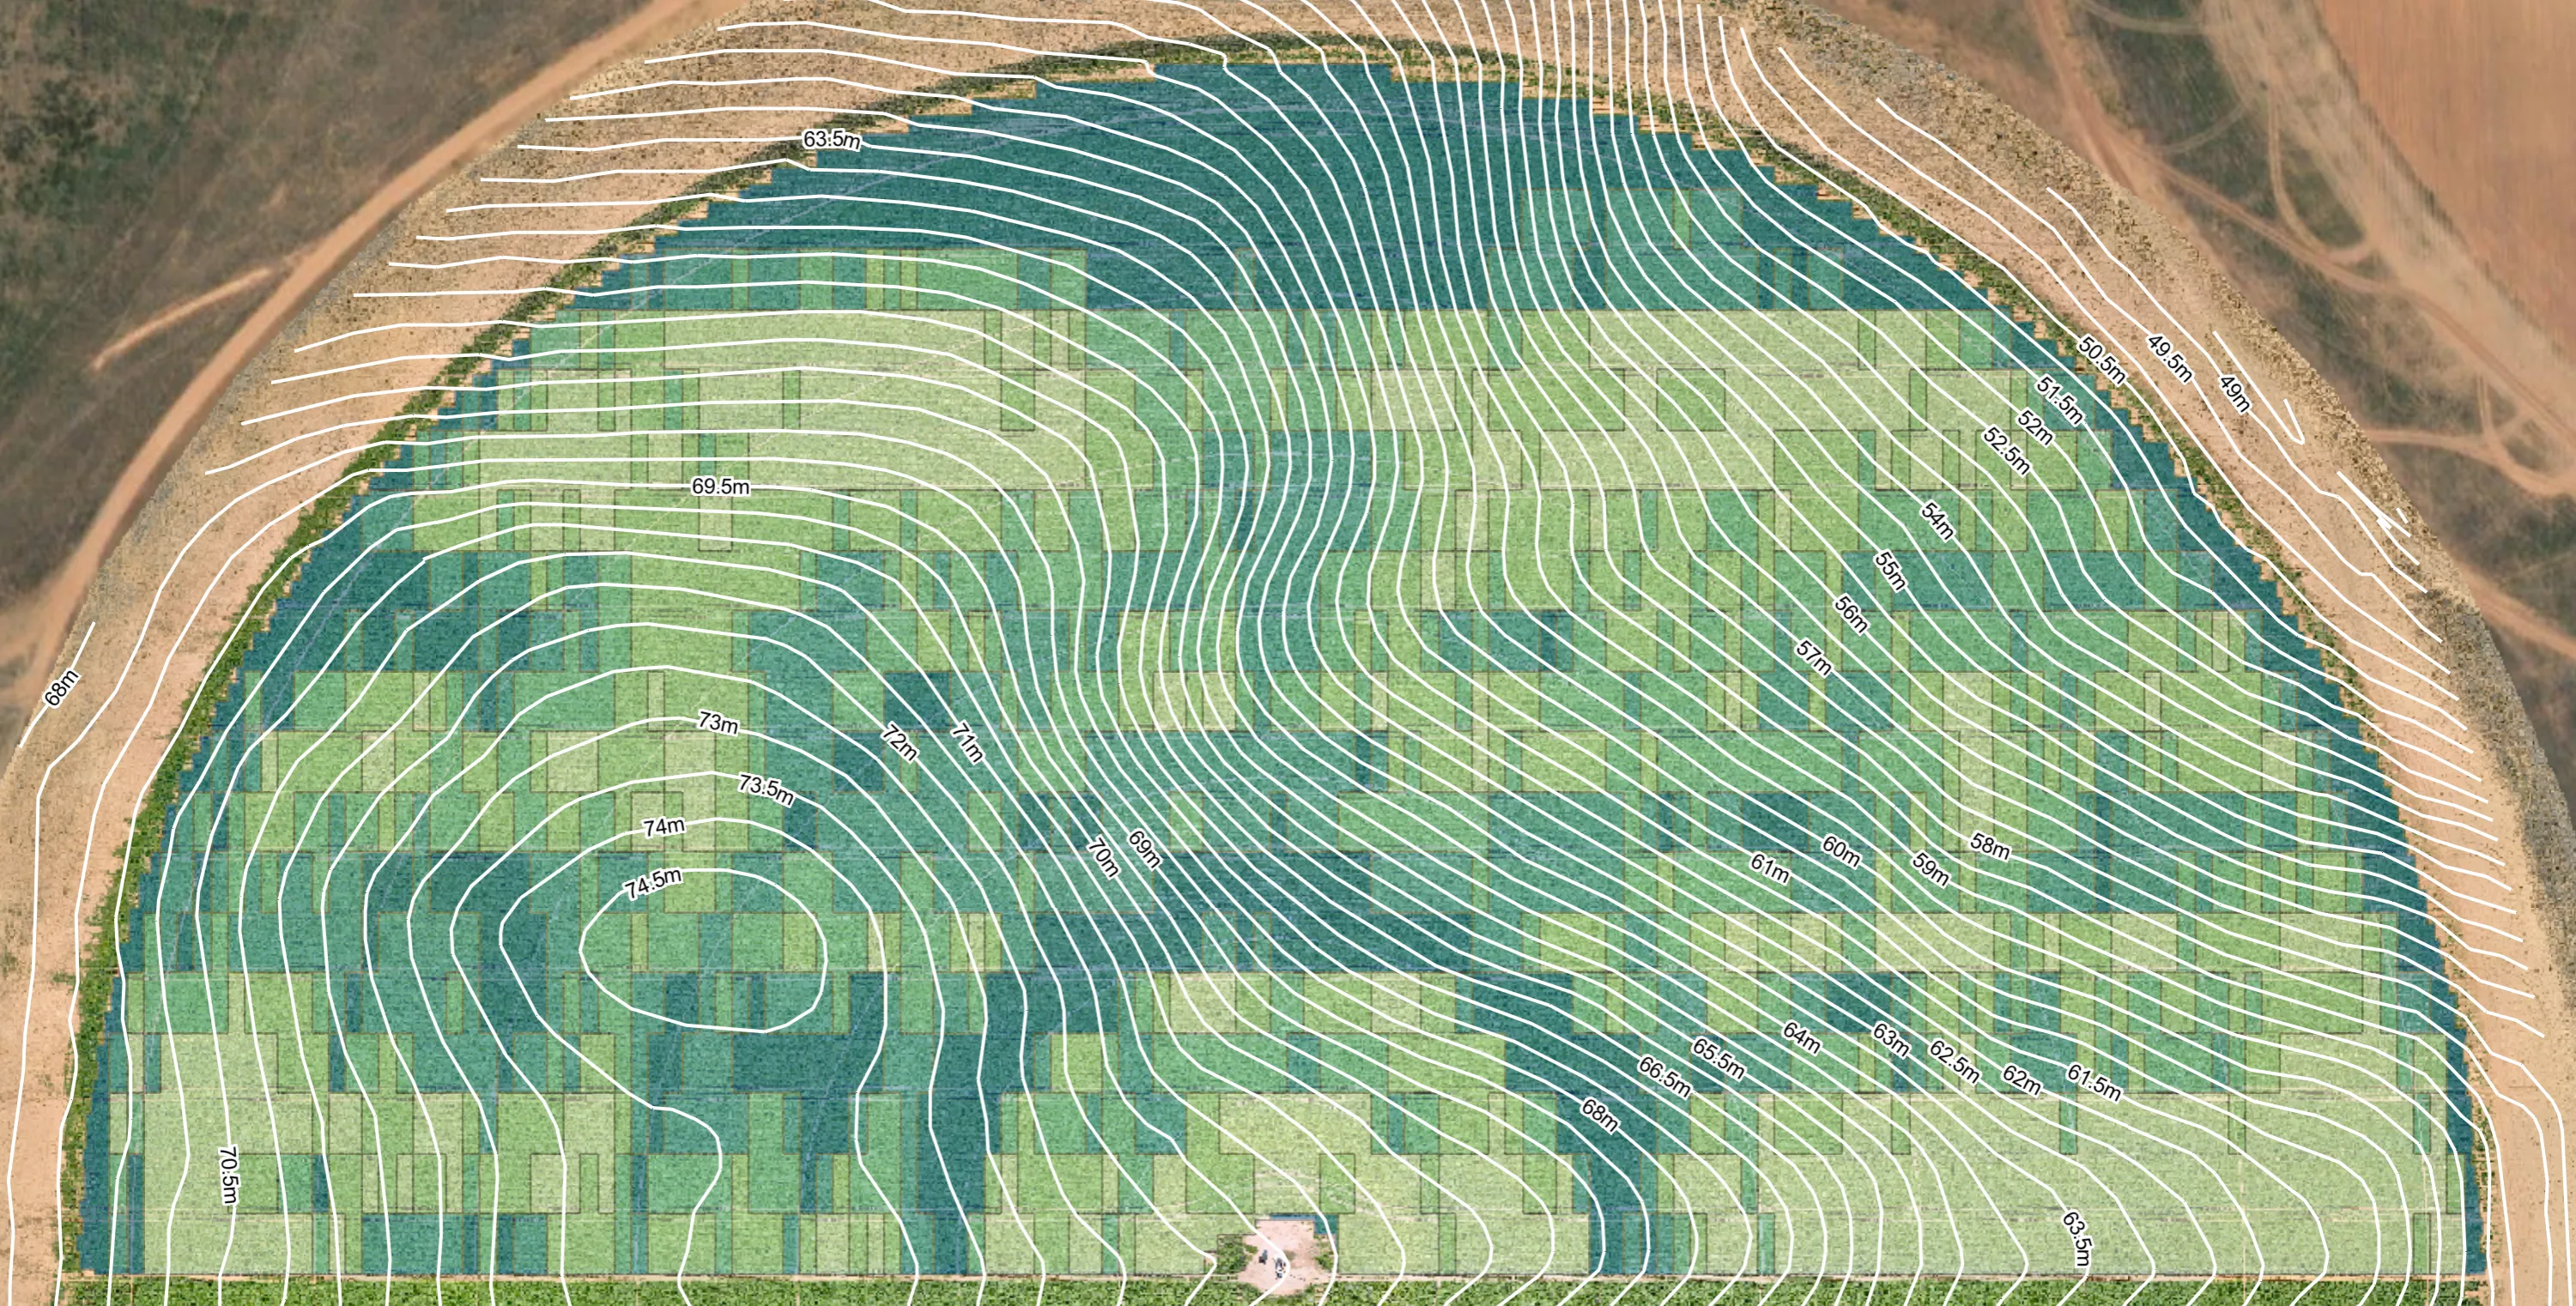
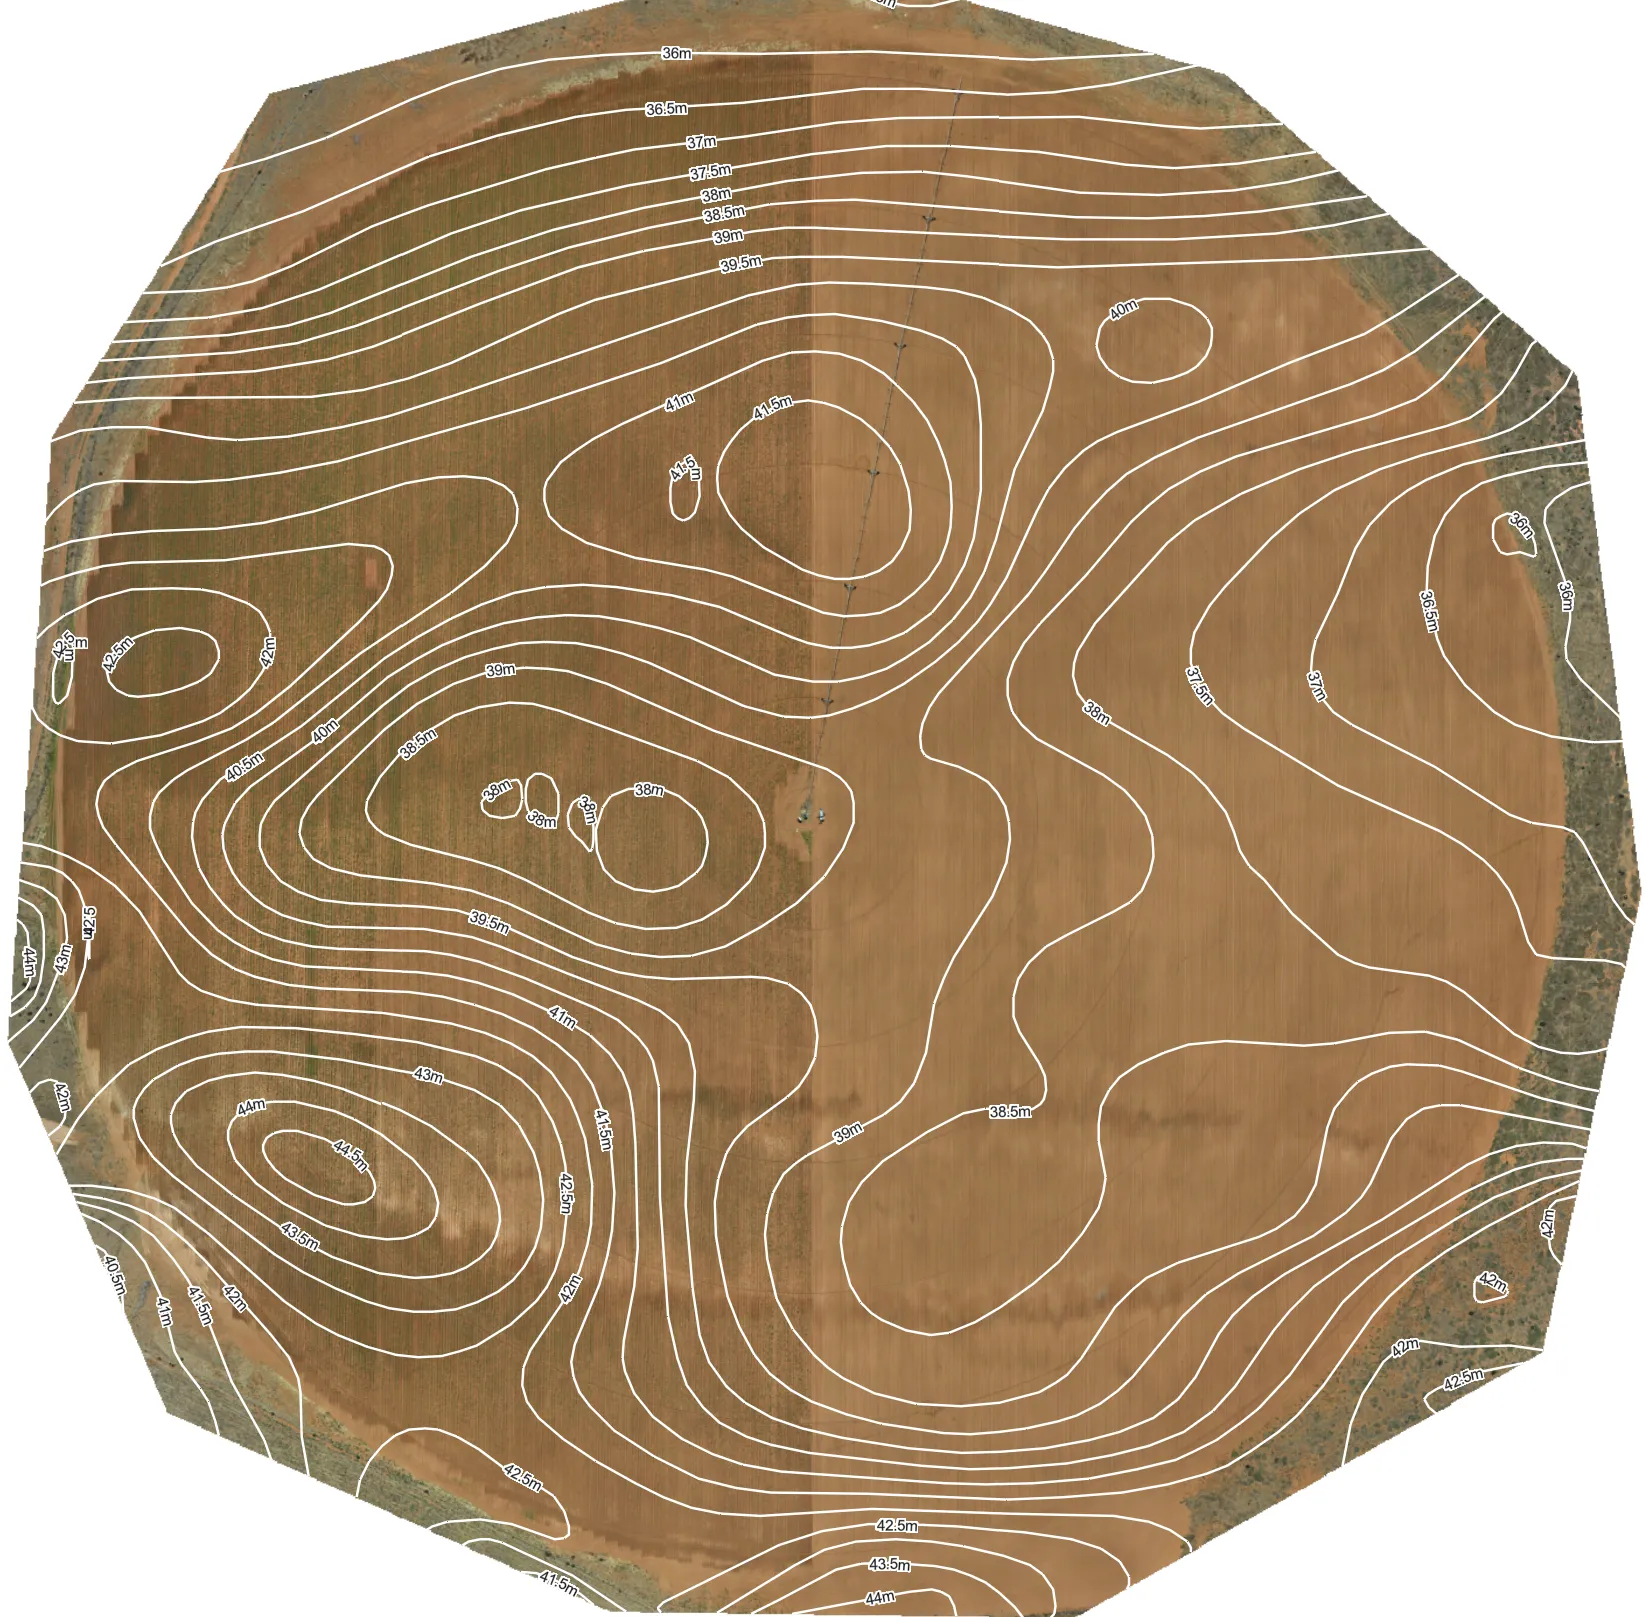
4. Countour Mapping
Best done before emergence, the contour mapping can help to understand wet spots or weak spots, or can help inform and site preparation and land planning activites before planting. Some have even used this as the basis for a once of variable rate spreading map
Why choose AirborneLogic?
Your crops – your timing
Unlike some providers who only get their plane in the air once or twice a season, drones allow you to capture data far more often – this means you always have the latest info on what’s happening to your crop.
Deal with humans, not algorithms
No farm is the same. We work with you to customise our analysis to your needs. Variable rate spreading – we need to know the width of your spreader. Emergence rate mapping – we need to know your planting plan so we can show you the varying emergence per variety
Vigormetrics in Grower Portal
Most farmers aren’t digital mapping experts – that’s why we’ve designed our Grower Portal (link to page about this). Our portal has been hand built to allow simple yet extraordinarily powerful custom analysis through our Vigormetrics analysis tools (link here). These tools allow plant level data to be visualised and aggregated to the variey or pivot scale.